⭕️SIDESWAYS TREND PER SHIB'S PREZZO

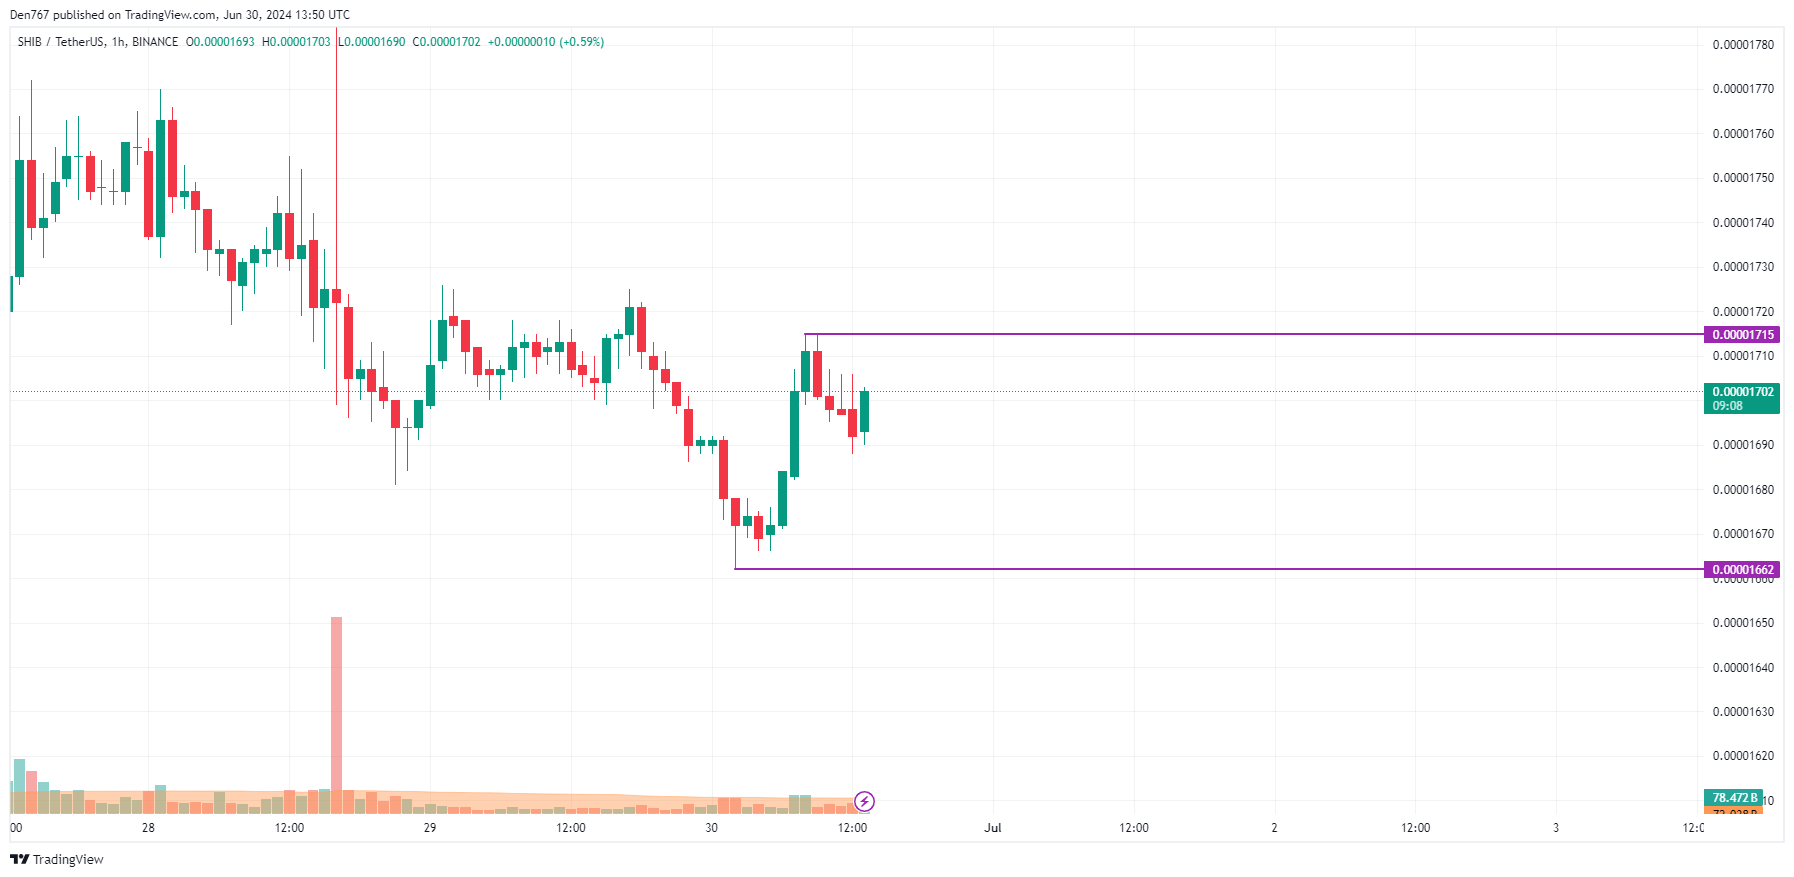
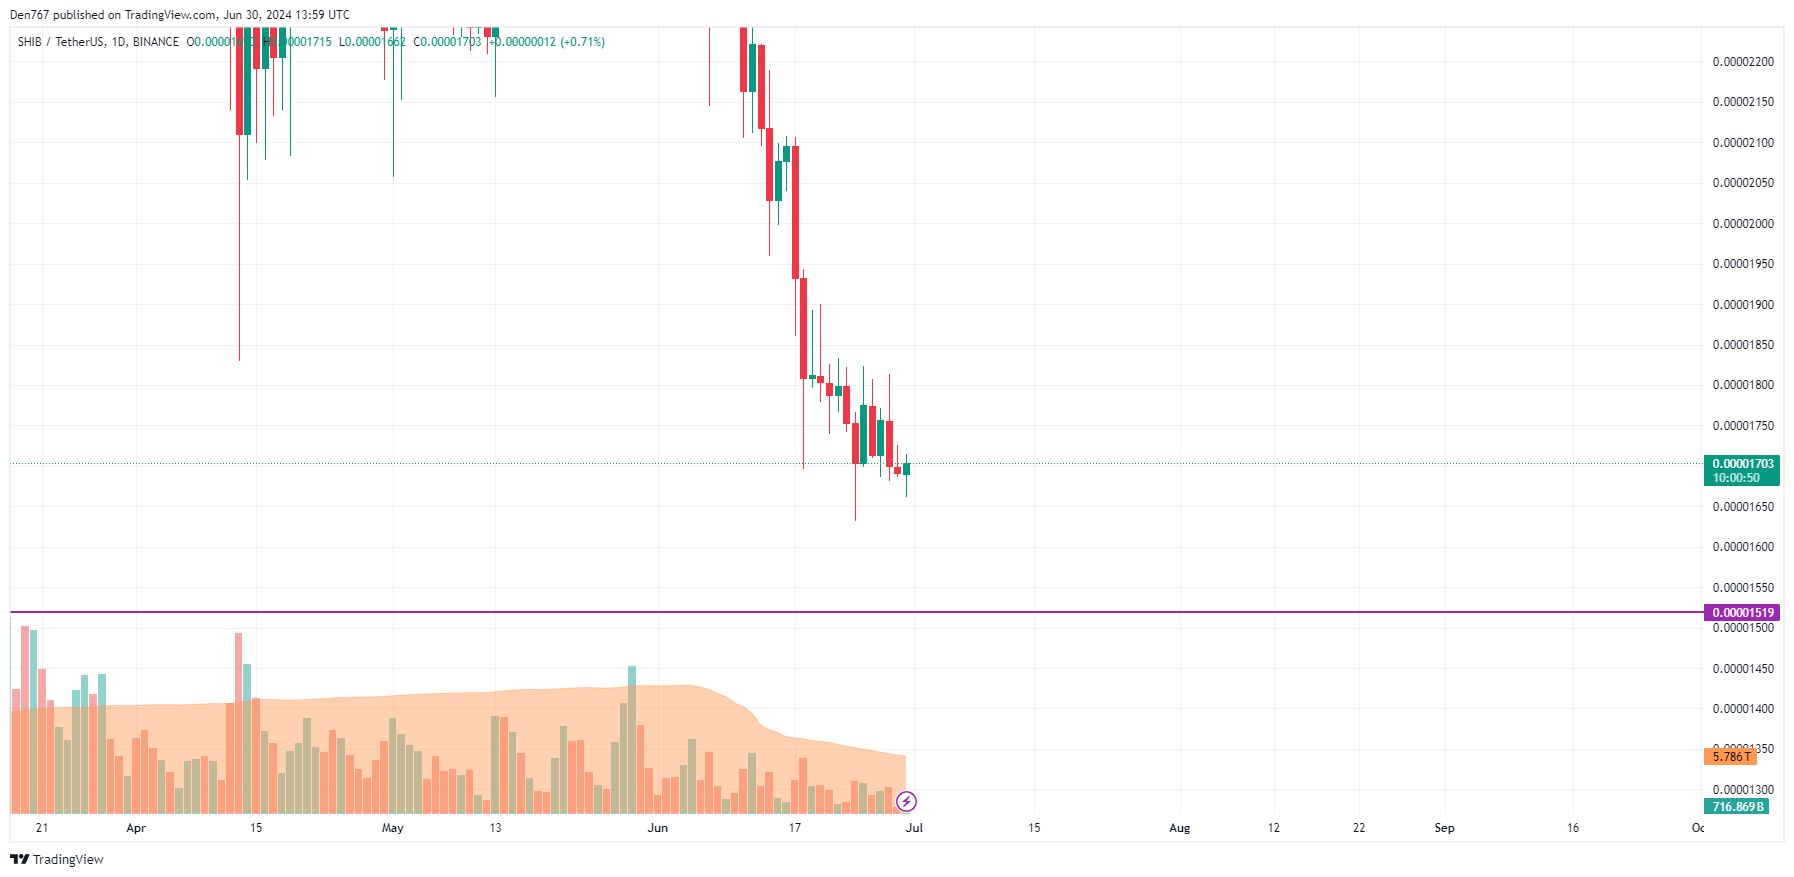
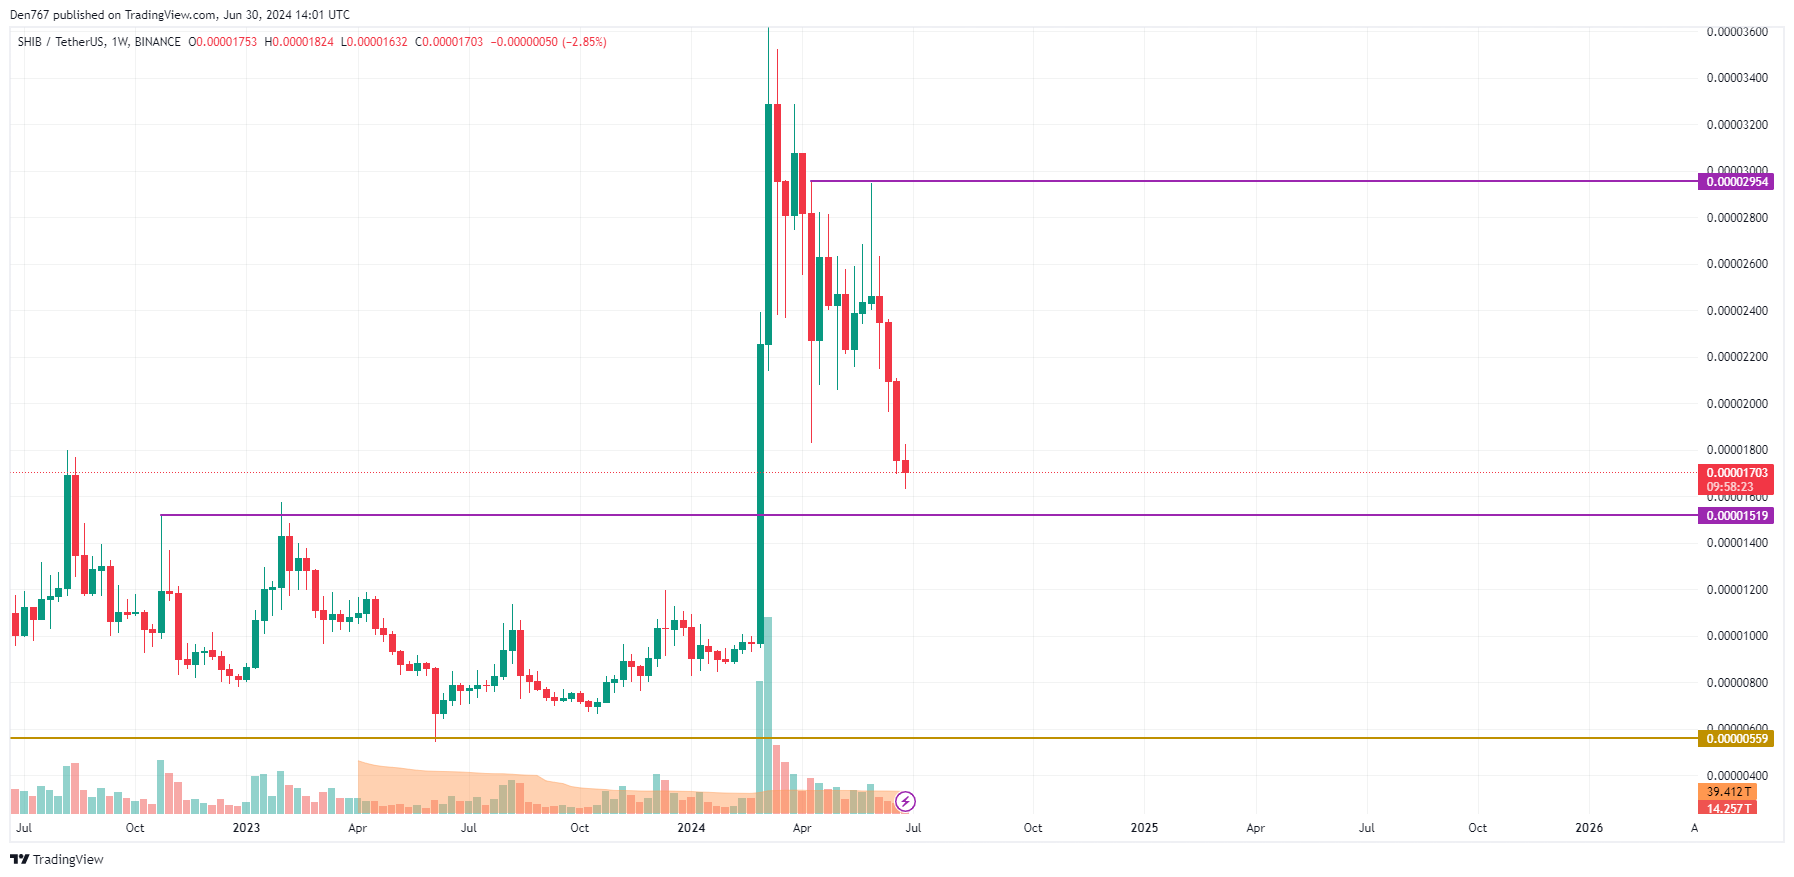
Giorno: 30 giugno 2024 | Ora: 23:00 La maggior parte delle criptovalute sta mantenendo una tendenza laterale nell'ultimo giorno della settimana. Il prezzo di SHIB è diminuito dello 0,47% dall'altro giorno e del 5,12% nell'ultima settimana. Sul grafico orario, il prezzo di SHIB sta testando una resistenza locale a $0,00001715 e potrebbe rompere verso la zona di $0,00001750. Sul grafico a lungo termine, né i tori né gli orsi dominano e non ci si aspettano forti movimenti nei prossimi giorni. La caduta di SHIB continua a medio termine e non ci sono ancora segnali di inversione. Se gli acquirenti perdono l'area di $0,000016, potrebbe verificarsi una rottura verso la fascia di $0,000014. Al momento, SHIB è scambiato a $0,00001704.
Most cryptocurrencies are maintaining a sideways trend on the last day of the week. SHIB's price has decreased by 0.47% from the other day and 5.12% in the last week. On the hourly chart, SHIB's price is testing a local resistance at $0.00001715 and could break towards the $0.00001750 zone. On the long-term chart, neither the bulls nor the bears dominate, and no strong movements are expected in the coming days. SHIB's medium-term decline continues, and there are no reversal signals yet. If buyers lose the $0.000016 area, a break towards the $0.000014 range could occur. Currently, SHIB is trading at $0.00001704.